2020, Vol. 1, Issue 1, Part A
Phylogenetic and evolutionary revision of some pheasants of northern Pakistan
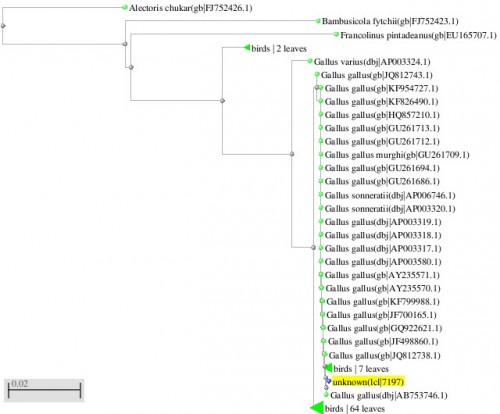
Fig. 1: Phylogenetic tree resulting from the Maximum likelihood analysis of CO1 gene sequence, Parsimony bootstrap 50% majority-rule consensus values were given above the branches and branch length were presented below the branches. Scale bar presented 5 changes per 100 characters. (Sequences of pheasants from Northern Pakistan)
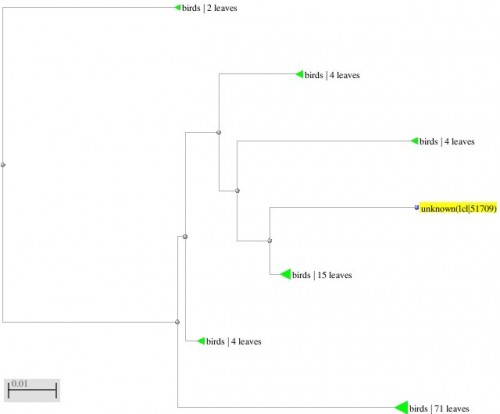
Fig. 2: Phylogenetic tree resulting from the Maximum likelihood analysis of CO1 gene sequence, Parsimony bootstrap 50% majority-rule consensus values were given above the branches and branch length were presented below the branches. Scale bar presented 5 changes per 100 characters. (Sequences of pheasants from Northern Pakistan)
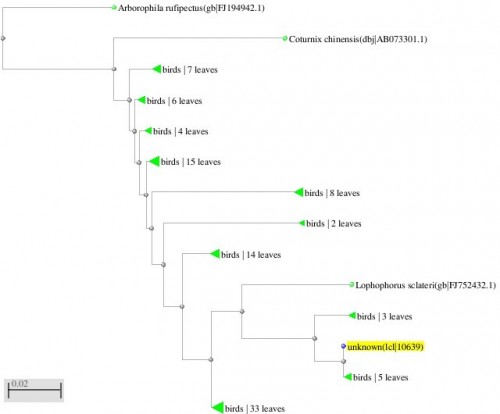
Fig. 3: Phylogenetic tree resulting from the Maximum likelihood analysis of CO1 gene sequence, Parsimony bootstrap 50% majority-rule consensus values were given above the branches and branch length were presented below the branches. Scale bar presented 5 changes per 100 characters. (Sequences of pheasants from Northern Pakistan)
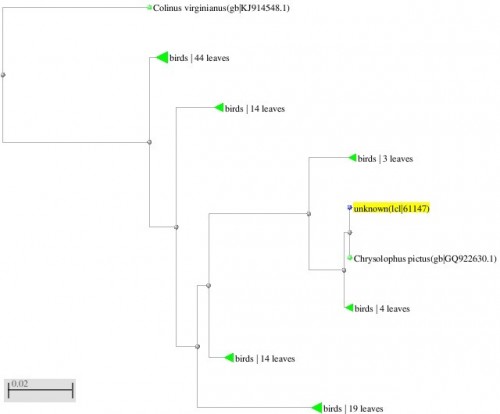
Fig. 4: Phylogenetic tree resulting from the Maximum likelihood analysis of CO1 gene sequence, Parsimony bootstrap 50% majority-rule consensus values were given above the branches and branch length were presented below the branches. Scale bar presented 5 changes per 100 characters. (Sequences of pheasants from Northern Pakistan)
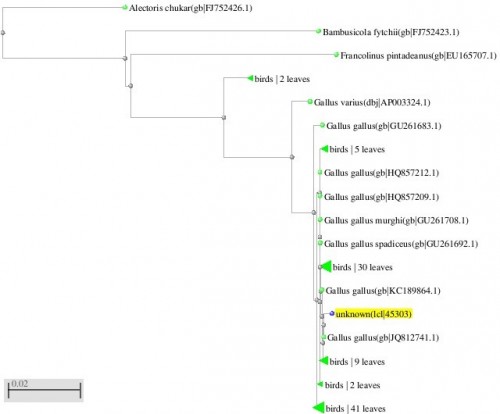
Fig. 5: Phylogenetic tree resulting from the Maximum likelihood analysis of CO1 gene sequence, Parsimony bootstrap 50% majority-rule consensus values were given above the branches and branch length were presented below the branches. Scale bar presented 5 changes per 100 characters. (Sequences of pheasants from Northern Pakistan)
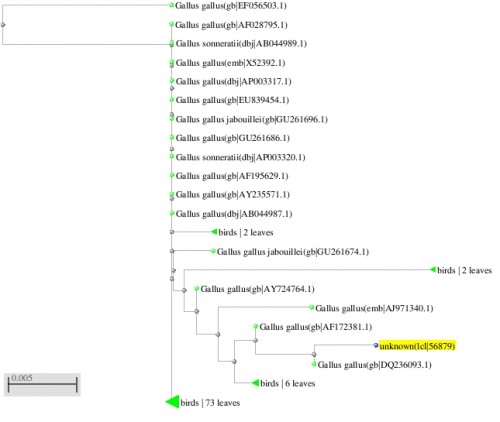
Fig. 6: Phylogenetic tree resulting from the Maximum likelihood analysis of cytochrome b gene sequence, Parsimony bootstrap 50% majority-rule consensus values were given above the branches and branch lengths were presented below the branches. Scale bar presented 5 changes per 100 characters. (Sequences of the current study from Pakistan).
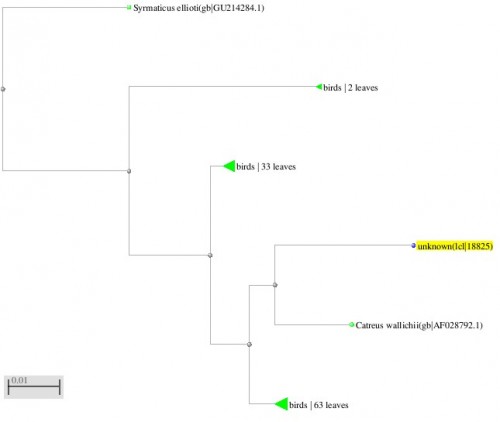
Fig. 7: Phylogenetic tree resulting from the Maximum likelihood analysis of cytochrome b gene sequence, Parsimony bootstrap 50% majority-rule consensus values were given above the branches and branch lengths were presented below the branches. Scale bar presented 5 changes per 100 characters. (Sequences of the current study from Pakistan).
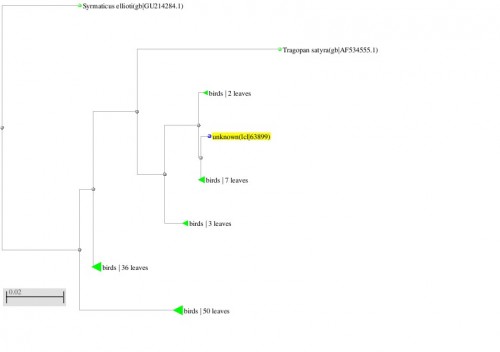
Fig. 8: Phylogenetic tree resulting from the Maximum likelihood analysis of cytochrome b gene sequence, Parsimony bootstrap 50% majority-rule consensus values were given above the branches and branch lengths were presented below the branches. Scale bar presented 5 changes per 100 characters. (Sequences of the current study from Pakistan).
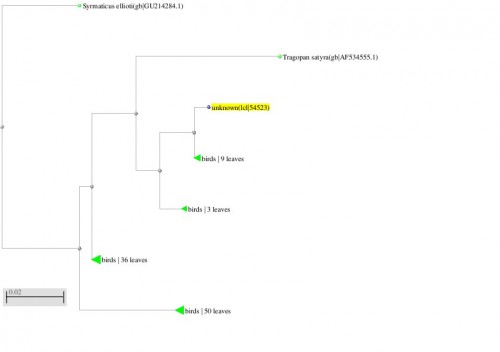
Fig. 9: Phylogenetic tree resulting from the Maximum likelihood analysis of cytochrome b gene sequence, Parsimony bootstrap 50% majority-rule consensus values were given above the branches and branch lengths were presented below the branches. Scale bar presented 5 changes per 100 characters. (Sequences of the current study from Pakistan).
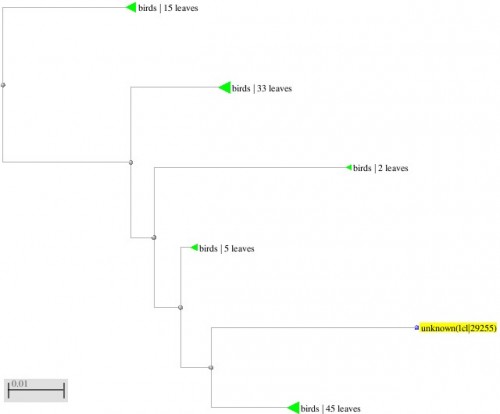
Fig. 10: Phylogenetic tree resulting from the Maximum likelihood analysis of cytochrome b gene sequence, Parsimony bootstrap 50% majority-rule consensus values were given above the branches and branch lengths were presented below the branches. Scale bar presented 5 changes per 100 characters. (Sequences of the current study from Pakistan).

Fig. 11: Phylogenetic tree resulting from the Maximum likelihood analysis of cytochrome b gene sequence, Parsimony bootstrap 50% majority-rule consensus values were given above the branches and branch lengths were presented below the branches. Scale bar presented 5 changes per 100 characters. (Sequences of the current study from Pakistan).
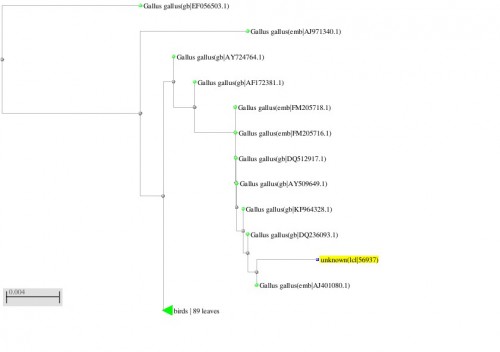
Fig. 12: Phylogenetic tree resulting from the Maximum likelihood analysis of cytochrome b gene sequence, Parsimony bootstrap 50% majority-rule consensus values were given above the branches and branch lengths were presented below the branches. Scale bar presented 5 changes per 100 characters. (Sequences of the current study from Pakistan).
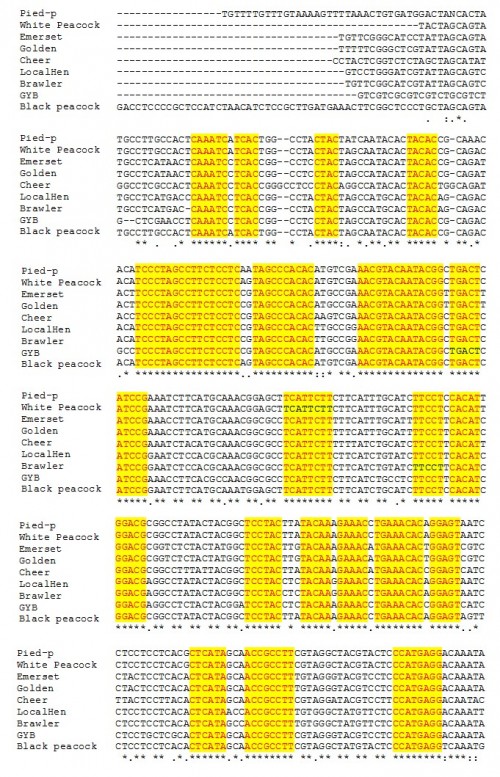
Fig. 13: The conserved areas of cytochrome c oxidase gene I in different pheasants included in the present study.
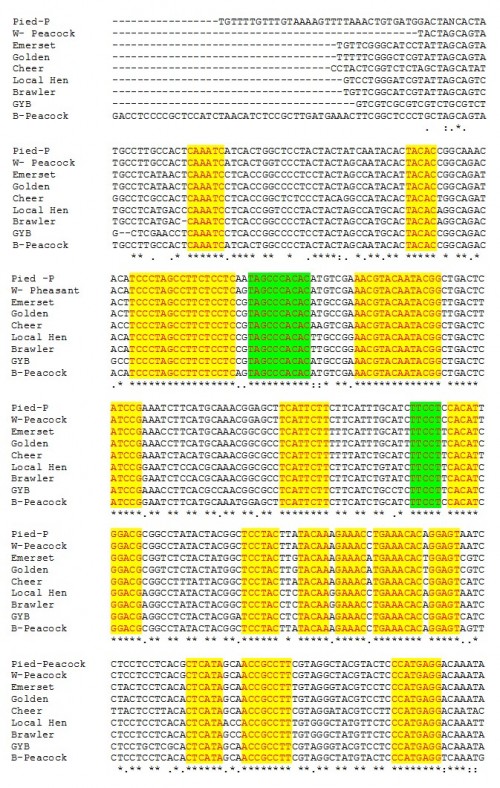
Fig. 14: The conserved areas of cytochrome b gene of different pheasants included in the present study.